Residential Rates Maps
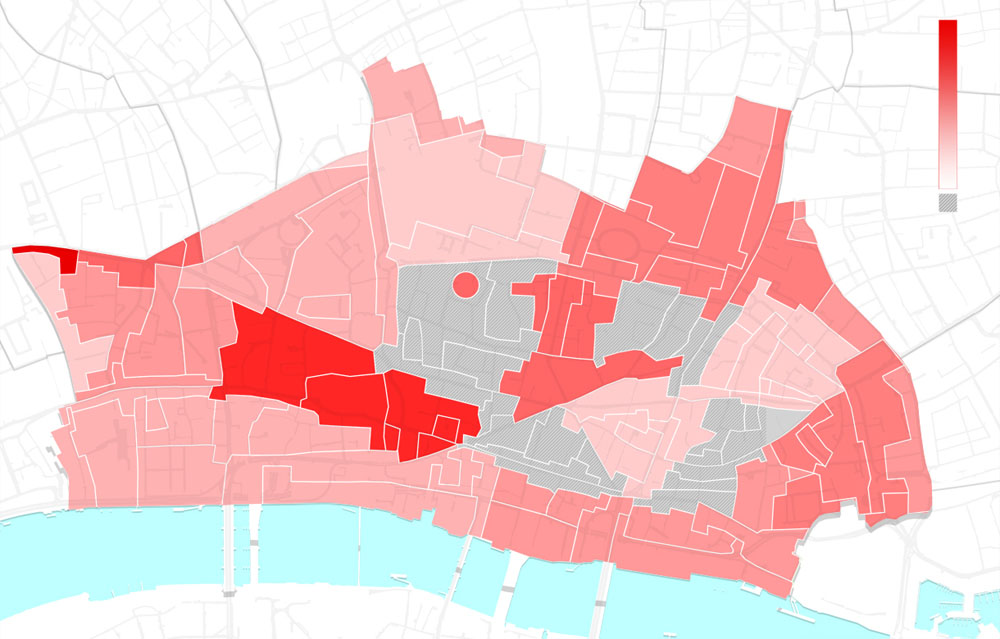
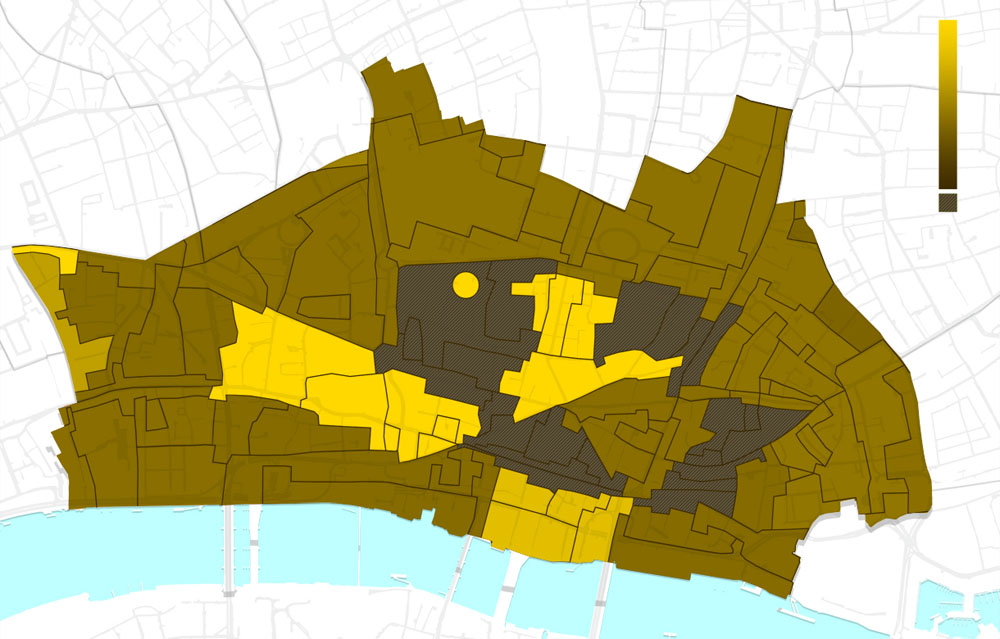
Forming part of a study into ownership of the City of London, this map was produced as part of a series that supported editorial content in a currently ongoing project. These visuals describe the total rates weekly rental rates and also the variance between the lowest and highest, of single bedroom flats within each postcode sector. For instance, the darker the red in each area, the greater the variance. Solid red equates to greater that £1,000 variance.


